|
TSOs & DSOs
Please use our A-Z INDEX to navigate this site where page links may lead to other sites, or see HOME
|
|
|
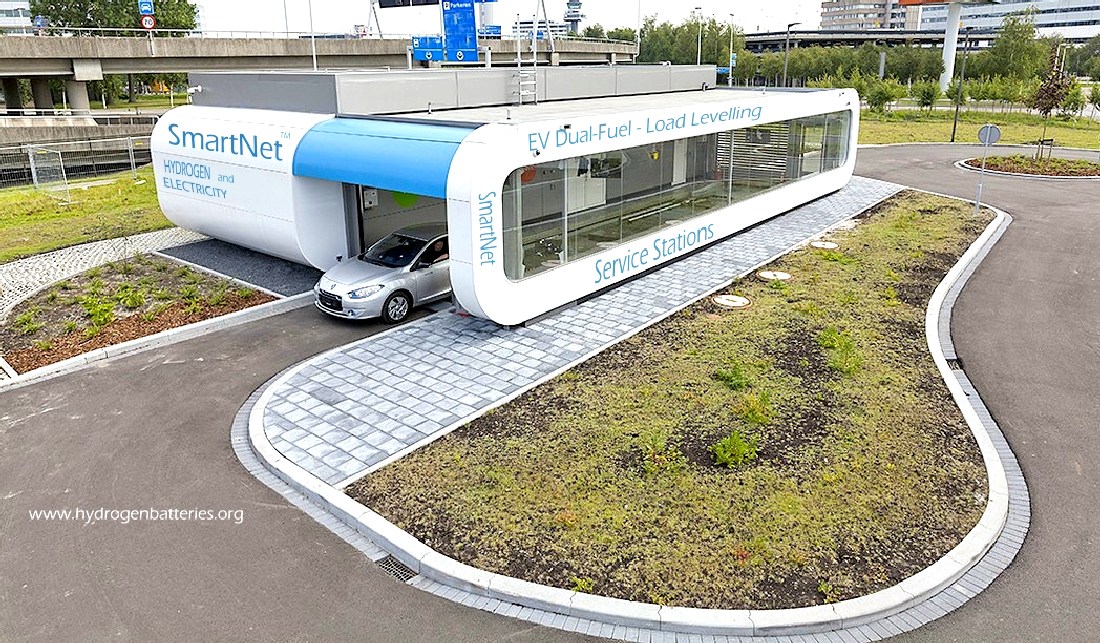
Imagine a means to store electricity as green hydrogen for the load levelling of national grids, while also supplying energy for commercial vans and heavy duty trucks. Fuel cells provide a way to convert hydrogen gas into electricity, but on their own they do not represent a solution. The way forward is with hydrogen batteries, as the beating heart of the Smartnet™ dual-fuel infrastructure.
In today’s electricity system the
Transmission System Operator (TSO) and/or Distribution System Operator (DSO)
has/have the responsibility to secure system stability.
1. The distribution grids connect the smaller electricity generators and most consumers (e.g. households and commercial consumers) to the electricity system (distribution networks work with 110 kV or less in Germany).
2. The distribution networks are connected to the transmission grids (220 kV and above in Germany), which transport electricity over larger distances.
The transmission grids connect the electricity networks across borders (these cross-country connections are called inter-connectors) and large conventional power plants (hard coal, lignite, gas and nuclear) are connected to the transmission grid in most cases as well.
Renewables, on the other hand, are primarily connected to the distribution grid. An exception are the offshore wind farms, which feed into the transmission grid directly.
Firstly we need to see how the concept of re-dispatch has developed. The following data on redispatch and congestion management is taken from the German regulator BNetzA. You can access the data here at the BNetzA. From 2013 to 2014 the number of days on which redispatch was required increased by roughly 50% from 232 in 2013 to 330 days in 2014.
Therefore, the costs for redispatch increased by 50 million from 2013 to 2014 (186.7 million). More importantly, in 2015, these costs more than doubled (412 million € in 2015) and the total amount of energy affected by redispatch reached 16.000 GWh in 2015 (compared to 5.197 GWh in 2014).
We need to note here that 2015 was a quite special year for redispatch in Germany, as many different factors and developments (lots of wind, unplanned shutdowns of power plants etc) added up and increased the need for redispatch in 2015. In 2016, the overall costs of redispatch fell again.
Remarkably, the first quarter in 2017 faced a new record-high demand for redispatch in Germany. In January alone, the need for redispatch equalled more than 40% of the annual redispatch requirement of the whole year 2016 (for details see BDEW 2017)). Primary driver for the significant need for redispatch was the high feed-in from wind energy in Germany.
Lost energy in Germany from feed-in management 200-2015 GWh curtailed annually
REDISPATCH COSTS -
TRIPLES FROM 2013 to 2015
Therefore, the costs for redispatch increased by 50 million from 2013 to 2014 (€186.7 million).
More importantly, in 2015, these costs more than doubled (€412 million € in 2015) and the total amount of energy affected by redispatch reached 16.000 GWh in 2015 (compared to 5.197 GWh in 2014). We need to note here that 2015 was a quite special year for redispatch in Germany, as many different factors and developments (lots of wind, unplanned shutdowns of power plants etc) added up and increased the need for redispatch in 2015. In 2016, the overall costs of redispatch fell again.
Remarkably, the first quarter in 2017 faced a new record-high demand for redispatch in Germany. In January alone, the need for redispatch equalled more than 40% of the annual redispatch requirement of the whole year 2016
(Ref. BDEW 2017). Primary driver for the significant need for redispatch was the high feed-in from wind energy in Germany.
In addition to redispatch, the need for feed-in management, i.e. curtailment of RES, has increased significantly from 2013 till 2015. In 2013, about 555 GWh of electricity production from RES was curtailed. This number increased to more than 4.722 GWh in 2015.
Compensation payments in €millions of Euros between 2009 - 2015
SUPPLY & DEMAND
The electricity grid is subject to physical laws – e. g., to Kirchhoff’s laws: supply and demand must be balanced to ensure an operating frequency within a given technical range and, thereby, maintain system stability.
Here, the term “flexibility” refers to the ability to manage and address imbalances between electricity supply and demand.
Historically developed electricity systems that relied on conventional power plants were designed to adapt the timing of electricity generation to largely inflexible demand (patterns).
Inelastic demand was mainly based on the requirements of the respective consumers, with the result that conventional power plants shut down or started up when needed. With marginal costs close to zero, wind and solar power plants always generate electricity given appropriate weather conditions, unless they need to be shut down.
In Germany, for instance, grid operators enforce such shut downs, which result in a curtailment of wind and solar power plants. These feed-in management measures are necessary to ensure grid stability.
In other countries, e. g., Denmark, negative electricity prices incentivize operators to shut down wind and solar power plants. A higher share of Renewable Energy Supplies (RES), for example in Germany, 55% in 2020, leads to less flexibility on the supply side: RES can only offer limited flexibility as it is only possible to lower their feed-in.
Various flexibility options are currently available to provide the required flexibility in current and in particular future electricity systems. These options include demand-side flexibility, sector coupling, supply-side flexibility, storages, and grid extensions to balance supply and demand.
In addition, for the period of the COVID-19 pandemic we
see that in 2020 the 75th percentile is lower
(€24.52 EUR/MWh) than the 25th percentile of 2017 (€26.70 EUR/MWh), 2018 (27.08 EUR/MWh), and 2019 (€33.85 EUR/MWh) which underlines the lower price level in 2020.
Safety mechanisms, such as redispatch and balancing power, keep the grid stable.
Such mechanisms are particularly important when a large proportion of electricity is produced by RES.
Sector coupling refers to both the coupling of the electricity sector with the heat or mobility sector and the consideration of corresponding transmission
capacities. From the perspective of the electricity sector, sector coupling would impact electricity consumption, particularly when electricity prices are low.
Supply-side flexibility entails a response by electricity generation units to ensure the electricity system’s balance. During the COVID-19 pandemic, a decline in electricity consumption combined with favorable weather conditions resulted in RES generating a high proportion of electricity. Yet, as discussed above, RES provide little flexibility and conventional power plants generated less or no electricity at all, and the increasing proportion of RES led to a decrease in supply-side flexibility.
There are different types of storage that can provide flexibility to electricity systems. These types of storage, e. g., hydro pumped or battery storage, generally differ from others in their power and storage
capacity. The share of hydro-pumped storage increased slightly during the COVID-19 pandemic. Furthermore, during the COVID-19 pandemic prices for balancing power remained stable. This level of stability might result from the fact that, in Germany, battery storage already contributes a large part of the
FCR. As a result, the supply of balancing power remained sufficient even in the absence of conventional power plants. These observations indicate that flexibility provided by storage still contributed to grid stabilization under (near) constant prices for balancing power.
The grid can also provide geographic flexibility as it bridges the gap between local electricity consumption and decentralized electricity generation. As a result of the COVID-19 pandemic, electricity demand in Germany decreased and differed on average significantly compared to previous years (cf. Table1). Thus, the grid had to transport less electricity. This situation led to an improved relationship between grid capacity and electricity consumption/generation. We can interpret this as a relative extension of the grid and therefore as an expansion of this flexibility option.
However, the amount of redispatched energy increased in comparison to the same period in the year before. This may be due to the higher share of volatile RES in the energy system. Regarding the electricity grid, it is also necessary to consider couplings with other countries. For instance,
Germany increased the electricity imports from neighboring countries during the COVID-19 pandemic.
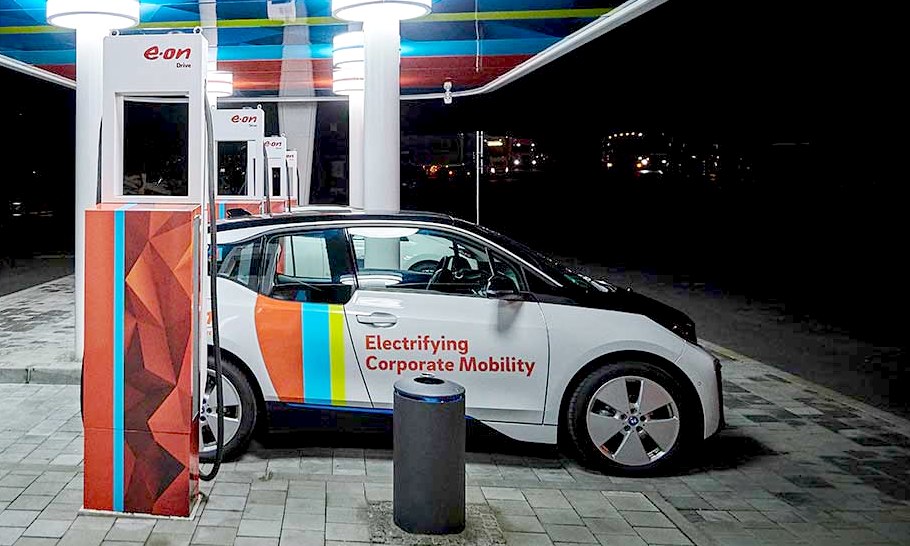
The future of transportation is electric, with fewer carbon emissions, zero air pollution and less noise, electric vehicles don’t just pay off for the environment – they also pay off for you. You can expect lower energy costs, lower total cost of operation.
LINKS & REFERENCE
https://www.comparethemarket.com/energy/electricity/ https://www.sciencedirect.com/science/article/pii/S0306261920317475 https://www.enerquire.com/blog/tso-dso-coordination-key-for-the-integration-of-renewables
Please use our A-Z INDEX to navigate this site
This website is provided on a free basis as a public information service. copyright © Climate Change Trust 2021. Solar Studios, BN271RF, United Kingdom.
|